Best practice for sweep frequency response analysis (SFRA)– Part 2
Robert Foster - Application Engineer, Megger USA
Sanket Bolar - Application Engineer, Megger USA
The first part of this two-part article, which appeared in a previous edition of Electrical Tester and is still available on the Megger website here, provided a brief introduction to sweep frequency response analysis (SFRA) testing, and looked at some of the factors that can affect test results adversely if they are not taken into account when setting up and performing SFRA tests. This second and concluding part of the article looks at more factors that can influence test results, and ends by summarizing recommendations for best practice in SFRA testing. Note that, to avoid confusion, the numbering of the figures follows on from the numbering used in the first part of this article.
Effect of tap position
The tap position affects SFRA results over a wide range of frequencies so it is important to record the tap position of all windings in the test report. To demonstrate the effect on results of the tap position on the winding being tested, three measurements were taken at different DETC tap positions on the HV winding phase A. The results are shown in Figures 20 and 21.
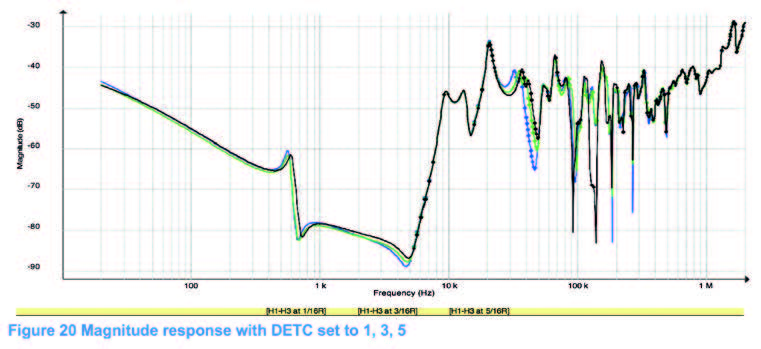
Figure 20: Magnitude response with DETC set to 1, 3, 5
Figure 21: Phase response with DETC set to 1, 3, 5
Differences are observed from the beginning of the sweep at 20 Hz up to 5 kHz where the curves overlay until differences again appear from 20 kHz up to 400 kHz. Changing the tap position on the non-tested winding also affects SFRA results, as can be seen in Figures 22 and 23. The LV winding of the transformer has an OLTC with 33 taps. The open-circuit SFRA measurement was carried out on the HV phase A of the transformer at three different tap positions of the OLTC on the LV side.
Figure 22: Magnitude responses with OLTC set to 16R, N, 16L
Figure 23: Phase responses with OLTC set to 16R, N, 16L
As can be seen, when the results obtained at the nominal tap position are compared with those obtained at the extreme tap positions of 16R and 16L, there are differences at both low and high frequencies. Once again the differences are observed at low frequencies up to 5 kHz and at higher frequencies between 40 kHz and 900 kHz. This illustrates how different components of the transformer affect the frequency response in different ranges, but no individual component is associated with a specific frequency range. In general, the low frequencies are most affected by the core of the transformer, but just adding extra windings to the circuit also affects the lowest frequency ranges. Differences would be expected as the sweep moves into the mid-high and high frequency ranges as, when the extreme tap positions are compared with the normal position, additional windings have been added to the circuit. When comparing the two extreme tap positions to each other, the curves follow each other very closely in the lower frequency ranges and then upon reaching 40 kHz, they diverge similarly to the comparison of the nominal to the extreme raised tap position, though not as significantly.
Figure 24: Difference in magnitude response between 16R and N tap positions
Figure 24 shows the difference between an open-circuit sweep on the phase A high-side winding with the OLTC set to the 16R tap position and a similar sweep with OLTC set to the N tap position. There is a large deviation of 23 dB at 526 Hz and several more deviations at 60 kHz and above. Although no faults had occurred in the transformer, simply altering the OLTC tap changer position from nominal to fully raised significantly affected the response at the lowest and highest frequencies.
Figure 25: Difference in magnitude response between 16R and 16L tap positions
When comparing the open circuit sweep on the phase A high-side winding with the OLTC tap position set to 16R and the sweep with tap position set to 16L, as shown in Figure 25, there is essentially no deviation until 40 kHz. Above this frequency, the curves diverge in a similar way to those shown in Figure 24 but the difference is not as large. Note that the y-axis scale in Figure 24 is different from that in Figure 25. Even though both measurements have the same amount of windings in the circuit, there is still a difference in the response due to the reversing switch, albeit a much smaller difference than between all OLTC winding turns in the circuit and none.
The results show that the tap position of both the tested and the non-tested winding affects the SFRA measurement results. If this is not taken into account when SFRA results are being made, the analysis could lead to a core problem or connection issue being suspected when in reality the differences relate only to a difference in tap changer position. When comparing one tap position to the next or fully raised to fully lowered, the differences are likely to be minor and may be overlooked, but if two taps at the extremes are compared, the difference in response can easily be misinterpreted as a fault. To ensure proper analysis and avoid misdiagnosis of faults it is therefore essential to note the tap changer position(s) while performing SFRA tests and to make future measurements using the same tap position(s) as those used for the fingerprint measurements.
Effect of the reversing switch
When testing a transformer with an OLTC that has a reversing switch, even if two measurements are carried out at the same nominal tap position, the results may vary slightly based on how the tap position is approached. This happens on designs where the reversing switch contacts are positioned differently when the tap changer is lowered to the nominal position compared with when it is raised to the nominal position.
Two open-circuit measurements were carried out, one approaching the nominal tap position from R1, the other approaching from L1. The results are shown in Figures 26 and 27. It can be seen that in this case there is no deviation between the curves, most probably because the transformer has a reactive type tap changer. Nevertheless, care should still be taken during SFRA testing always to approach the nominal tap position from the R1 tap, and this should be noted on the report to ensure consistent testing in the future.

Figure 26: Magnitude plots comparing response when nominal tap position is approached from R1 and from L1
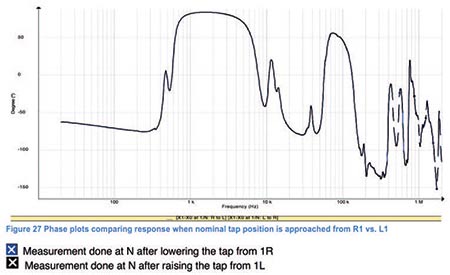
Figure 27: Phase plots comparing response when nominal tap position is approached from R1 and from L1
Effect of shorting lead length in short-circuit measurements
The shorting connections used for short-circuit measurements should be point-to-point – that is, as short as possible. The length of the shorting leads can influence measurements in the high frequency range as shown in Figures 28 and 29. The difference is plotted in Figure 30 and as can be seen, the curves follow each other closely for most of the sweep, but there are differences when the frequency exceeds 1 MHz. Figure 31 shows both point-to-point shorting (left) and shorting with long cables (right). As can be seen, the length of the shorting leads can influence results in the high frequency area. It is, therefore, good practice always to use point-to-point shorting.
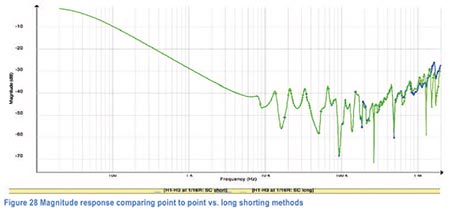
Figure 28: Magnitude response comparing point-to-point and long shorting methods
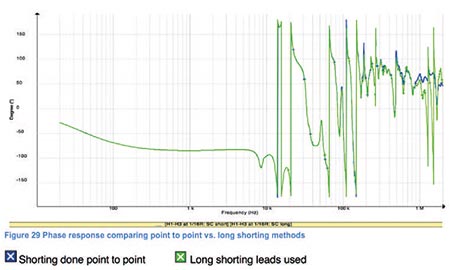
Figure 29: Phase response comparing point-to-point and long shorting methods
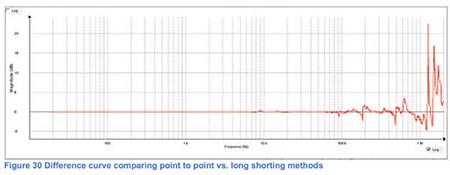
Figure 30: Difference curve comparing point-to-point and long shorting methods
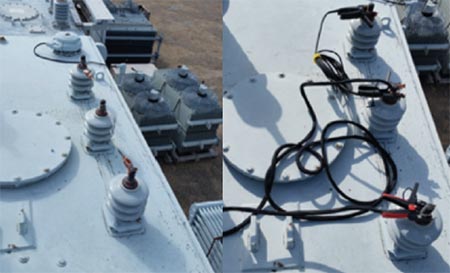
Figure 31: Point-to-point shorting and shorting with long cables
Effect of test voltage
When SFRA test sets were first introduced, different manufacturers used different test voltages. Most modern SFRA test equipment is however standardized on a test voltage of 10 Vp-p. This is important because changing the test voltage can affect the sweep in the low frequency region because of the core influence. At higher frequencies where the winding dominates, the sweep becomes independent of the applied test voltage. An example of this can be seen Figure 32, which shows the results of high-side open-circuit tests carried out at 10 Vp-p, 5 Vp-p and 1 Vp-p. The transformer under test in this instance was a Dd0 13.8 kV/480 V 1MVA 3Φ unit.
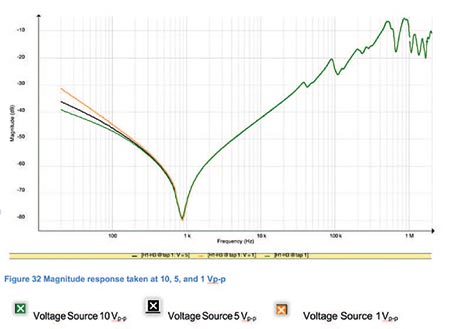
Figure 32: Magnitude response at 10 Vp-p, 5 Vp-p and 1 Vp-p
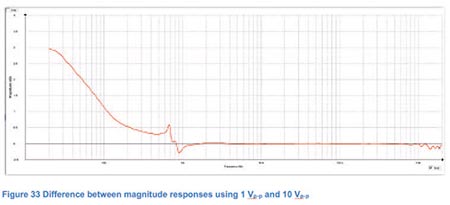
Figure 33: Difference between magnitude responses with 1 Vp-p and 10 Vp-p test voltages
Using 10 Vp-p as a reference, it can clearly be seen that as the voltage is decreased to 5 Vp-p the magnitude curve is shifted upwards by 3 dB at low frequencies. This effect steadily decreases until about 500 Hz where it increases slightly. The 10 Vp-p magnitude then becomes slightly greater before the curves essentially overlay at 1.1 kHz and above. The difference plot is shown in Figure 33. When comparing the 1 Vp-p trace to the 10 Vp-p trace, the difference curve follows the same pattern but the difference starts at 8 dB rather than 3 dB.
It can be seen that the test voltage affects the results in the lowest frequency ranges up to about 1.1 kHz, shifting the response upwards on the dB plot as the voltage is decreased. Once the frequency reaches 1.1 kHz, the response is essentially a winding response, and the test voltage no longer affects the results. This means that when performing and analyzing SFRA tests, the technician must know the test voltage that has been used in order to make accurate comparisons with previous and subsequent tests. This will help prevent data being misinterpreted as showing there is a problem in the core when the reality is that a comparison is being made between a recent sweep carried out at 10 Vp-p and an older sweep carried out at some other voltage.
Consideration of the delta stabilizing winding
Some transformers have a delta stabilizing winding in which two terminals (Y1 and Y2) are connected together and grounded during service. It is recommended that these windings remain shorted together during SFRA testing but be disconnected from ground. Figure 34 shows a set of low-voltage winding open-circuit measurements taken on a YNyn0D11 140 kV/11.5 kV 40 MVA 3Φ transformer. The transformer suffered a short circuit between phases L1 and L2 on the low-voltage side, which developed into a three-phase fault before it was cleared. To obtain the results shown in Figure 34, the connection between the Y1 and Y2 delta winding was broken as well as the connection between the delta winding and ground.
/sfra2_fig34_sept2018.jpg)
Figure 34: LV Open circuit measurements with tertiary open
The three phases show the expected response up to 10 kHz. At this point, since the three windings are similarly constructed, the response from each of the phases would be expected to be very similar. Instead, they start to significantly deviate after the local maximum of 26 kHz and don’t line up again until above 530 kHz, where slight variation would be expected due variations in the connecting leads and wiring. These results could easily be interpreted as showing that the windings had been distorted by the fault.
/sfra2_fig35_sept2018.jpg)
Figure 35: LV Open circuit measurements with tertiary shorted (Y1-Y2)
However the tests were performed again, this time with the Y1 and Y2 terminals shorted together but still isolated from ground. The results can be seen in Figure 35. The response in the low frequencies shows a little more difference than might be expected between L1 and L3 but as soon as the sweeps reach 2 kHz, all three phases essentially line up indicating that the windings are in good condition. If the results of Figure 34 had been analyzed without realizing the tertiary was open, it is likely that the transformer would have been condemned as defective when, in fact, none of the windings was significantly harmed by the fault. This demonstrates once again that tests must be performed in a consistent manner, following the recommendations of the standards. In this case, the recommendation it is to leave the Y1 and Y2 terminals shorted together but disconnected from ground during open circuit tests.
Verifying instrument function
Even if the transformer is in the same configuration as in previous tests and all the connections are made in exactly the same way, there is still one issue that could arise and is largely beyond the control of the technician: there may be a problem with the SFRA test instrument or its leads. There are two recommended methods for verifying that the equipment is working properly. The preferred method is to connect the instrument to a test circuit that has a known frequency response and compare the current trace to an earlier reference trace. If a reference circuit is not available, the alternative method is to connect the source lead to the measurement lead and see that the expected 0 dB response is produced, within the accuracy of the instrument. These checks should ideally be performed before starting tests on a transformer. At the very least, the reference sweep should be conducted if the latest transformer trace does not line up with the fingerprint or if the test equipment is suspected to be faulty. An example of a reference trace spanning a frequency range 20 Hz to 2 MHz varying from -100 dB to -23 dB is shown in Figure 36.
/sfra2_fig36_sept2018.jpg)
Figure 36: Reference trace for verification of instrument operation
Summary
The examples in this paper clearly show that various normal conditions of the transformer as well as connections, grounding, types of shorting cables used, and even tests done before SFRA testing can all affect SFRA test results, sometimes leading to a false indication of a problem in the transformer. Several conditions related to the reluctance of the core can affect the low frequency region below 2 kHz. This was evident when the voltage level of the input source was varied between 1 V and 10 V as well as when the sweeps were performed before and after magnetizing the core.
Both instances of magnetization and changing the source voltage shifted the curve in magnitude and in frequency. A similar phenomenon is observed if the core ground is removed and not reattached or if, for some reason, the core ground becomes detached internally. It is also possible for the results to be affected in the highest frequency ranges, mainly above 200 kHz, leaving the response at lower frequencies unchanged. Factors that can affect the higher frequencies include how connections are made, in particular how they are grounded, what type of grounding braid is used and how the terminals are shorted in the short circuit tests. Finally, changing the tap position, both DETC and LTC, can affect both the high and the low frequency ranges.
To ensure reliable, repeatable measurements, SFRA tests must be performed methodically and consistently. The test technician should note such factors as the test voltage used and the tap position of both the DETC and LTC. It is recommended that the test be performed with DETC in the “as found” or “in service” position and that the LTC should be placed in the extreme raised position. If however the LTC is placed in the neutral position, it should be switched to neutral from the raised tap position and the previous tap position should be noted.
To minimize the influence of grounding, a flat braided ground that is as short as possible should be used. When shorting leads are used, these should also be kept as short as possible. Taking pictures or noting connections for future reference will help to minimize the possibility of inadvertently making different connections in the future. SFRA testing should be performed before winding resistance tests, but if a winding resistance has already been performed or magnetization is suspected, the transformer should be demagnetized before SFRA testing commences. Finally, any non-standard conditions, such as lack of oil in transformer or transportation test bushings, should be recorded. By performing SFRA measurements in a consistent manner, the results will be more comparable to the fingerprint results making analysis easier and more accurate.


